(11.1)
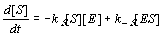 The number of molecules F is also diminished during the time interval dt by the enzyme lock EF, though this
need not be for ever. There is always a certain probability that the locked molecules F will escape and this
probability is given by a constant k-F
The number of molecules F is also diminished during the time interval dt by the enzyme lock EF, though this
need not be for ever. There is always a certain probability that the locked molecules F will escape and this
probability is given by a constant k-F
(11.2)
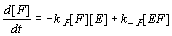 Assuming that each activated complex ES decomposes into a constant number of molecules P we can write
(11.3)
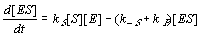
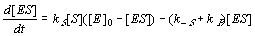
 Changes of [ES] correspond to the three reactions E+S>ES, ES>E+S, ES>E+P:
(11.4)
 Similar equations might also be written for [EF] and [E], but it is easier to replace them by the two constraints
(11.5-6)
 where [E]0 and [F]0 are initial concentrations at the beginning of a process (e.g., at the beginning of batch
fermentation). Only now does the number of unknown concentrations [S], [P], [E], [F], [ES], [EF] agree with
the number of equations. The system is complete and can be solved in a similar way as the gas lighter in Chapter
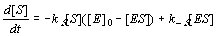
7. Assuming that the inhibitor concentration [F] is negligible, system (11.1-6) can be reduced to the two
following equations for two unknowns [S] and [ES] :
where [E]0 and [F]0 are initial concentrations at the beginning of a process (e.g., at the beginning of batch
fermentation). Only now does the number of unknown concentrations [S], [P], [E], [F], [ES], [EF] agree with
the number of equations. The system is complete and can be solved in a similar way as the gas lighter in Chapter
7. Assuming that the inhibitor concentration [F] is negligible, system (11.1-6) can be reduced to the two
following equations for two unknowns [S] and [ES] :
(11.7-8)
 If the rate of the activated complex changes is also negligible (d[ES]/dt=0), the concentration [ES] can be
eliminated from Eqs. (11.7-8), giving the equation
If the rate of the activated complex changes is also negligible (d[ES]/dt=0), the concentration [ES] can be
eliminated from Eqs. (11.7-8), giving the equation
(11.9)
 where kM=(kP+k-S)/kS. "Nihil novi sub sole", Eq.(11.9) was formulated by Leonor Michaelis and Maud Menten in
1913.
where kM=(kP+k-S)/kS. "Nihil novi sub sole", Eq.(11.9) was formulated by Leonor Michaelis and Maud Menten in
1913.It is interesting to compare the M-M equation (11.9) with the Monode equation (8.70), which describes biomass growth.
Solution of Eqs.(11.1-8), was prepared in the following Excel table (the same procedure was used in Example 7.3). Row 8 is a header, initial concentrations are prescribed in row 9, and row10 is the first time step. For example column B follows from Eq.(11.9):[S]1=[S]0-dt kP[E]0 [S]0 /(kM+[S]0):
| Atime | B [S] (11.9) | C [S] (11.1) | D [ES](11.8) | E [P](11.3) | F [F](11.2) | G [EF] | H [E] |
| 0 | =s0 | =s0 | =0 | =0 | =f0 | =0 | =e0 |
| =A9+dt | =B9-dt*kp*B9*e0/ (kmm+B9) | =C9+dt*(kms*D9- ks*C9*H9) | =D9+dt*(ks*C9*H9- (kms+kp)*D9) | =E9+dt*kp*D9 | =F9+dt*(kmf*G9 -kf*F9*H9) | =f0-F10 | =e0-D10- G10 |
Subsequent rows 11,12,13,...., i.e. time steps 2,3,4,.... are only an extension of row 10. Typical results, time courses of the substrate concentration according to Eq.(11.9) and (11.1), are shown in Fig.11.6.

@TEC: 3. 3.2003 Change language to