RTD PREDICTION, MODELLING AND MEASUREMENT OF GAS IN REACTOR
Jiri Thyn, Pavel Strasak and Rudolf Zitny
Summary:
Problems of measurement and evaluation of RTD-residence time distribution of gas are presented and discussed.
Measurement of RTD in industry is mostly used in trouble shooting or for process intensification and
optimization. The special PC-programs have been prepared for optimal selection of RTD model and for its
verification by parametrical analysis.
The example of procedure used in trouble shooting is demonstrated on the data of impulse response of
gas measured with radiotracer in the heat exchanger. The results of methods for identification (deconvolution)
with regularization, from so called nonparametrical analysis are presented.
The combined model described by a set of differential equations has been suggested for gas flow in the
reactor with baffles. The model identification by nonlinear regression yields important process parameters, the
relative dead volume and mass exchange coefficient e.g.
The prediction of RTD for another steady states conditions (for another flow rate e.g.) can be done on
the basis of dimensionless impulse response. However this similarity assumption should be verified by another
experiments, as the same flow pattern as well the same relative active volume for different steady conditions are
supposed.
Another possibility is a prediction of a change of RTD (change of values of RTD model parameters)
on the basis of numerical solution of transport equations for fluid dynamics using particle tracking method or
transient analysis of temperature pulse spreading. The results of RTD prediction for a broad range of Reynolds
numbers by using CFD software Fluent are presented.
1. Introduction
Measurement of Residence Time Distribution of gas in an equipment of chemical or petrochemical
industry is common mean for process analysis or for trouble shooting. Two radioactive gas 41Ar ( -1.2 MeV,
T1/2= 110 min) and 79Kr ( - 0.511 MeV, T1/2=34h) obtained in a research nuclear reactor are frequently used as a tracer
which can be detected through the wall of pipes.
The processes mostly analyzed by radiotracer gas are very fast with mean residence time in seconds
or even less than one second. The realization of a tracer injection can not be short enough and an input
can not be judge as the Delta - function and has to be detected as well as the output (response). RTD is evaluated from the response to the arbitrary
input function by identification methods. A nonparametrical analysis is often used
as the first step of the evaluation in trouble shooting while a parametrical analysis is used in an optimization
or in a process intensification.
Identification by nonparametrical analysis known as deconvolution is ill-posed process, i.e. very
small fluctuations of measured response can cause dramatic changes of results (RTD). The PC program [1],
which uses the special techniques (regularization) for limitation of incorrect oscillation has been used in the analysis of gas flow in the tubes of heat exchanger. The results are the impulse response E(t).
Even more information about the flow structure can be obtained by identification done on the basis of
RTD model from the values of the model parameter. The mathematical model i.e. description of responses by
means of differential or algebraic equation can be suggested according to the shape of RTD (E(t) known from
the nonparametrical analysis e.g.) and according to character of apparatus. The results are values of model
parameter obtained for working conditions under which the experiment was realized.
The knowledge of RTD for a different steady states are requested in process optimization or
intensification. The simple, well known relation for different flow rate can be used, if the same flow structure
can be supposed :
EQ=Q E*/V
The similarity assumption should be verified by another experiment prepared for another steady state
conditions. This is mostly not possible to realize especially in an industry. Another
possibility is a prediction of RTD change or the value of parameters on the basis of numerical
solutions of transport equations for fluid dynamics using particle tracking method or transient analysis of a
temperature pulse spreading (supposing temperature/tracer concentration similarity). This approach was used for
gas flow structure analysis in chambers with or without baffles. The results of RTD prediction for a broad range
of Reynolds number by using software FLUENT are presented.
2. RTD - Nonparametrical analysis of gas flow in tubes of heat exchanger.
The gas flow residence time distribution was studied on two shell and tube heat exchangers (1-1, with
2000 tubes;V~14m3; ~1.2 kg/m3;T~500oC and mean residence time < 1 sec), connected in parallel with chemical reactor. The
different temperature gradient in the geometrically identical exchanger were only one indication why the
efficiency of reactor decreased. The measurement of RTD should say if the flow structure in the both is the
same or not.
The measured input and output changes in concentration were treated by special identification methods
useful for the signals with fluctuations.
2.1 Identification methods with regularization
Impulse response E(t), input X(t) and output Y(t) courses of radiotracer concentration are related by the
convolution integral. To find out E(t) from the integral equation (deconvolution) is easy only in the case when the stimulus
functions X(t) is short, sharp pulse and response Y(t) is smooth (without non-system fluctuations, which are so
typical e.g. for detection of radiotracers). Otherwise ill-posedness of problem yields wildly oscillating solution
E(t).
There exist several techniques how to remove incorrect oscillations the most natural ones being based
upon suitable choice of type of E(t) approximations. The coefficients of impulse response are computed by
least square methods with regularization (using FFT or in time domain integration).
The PC programs enable selection of three different basis functions (splines, Laguerre functions and goniometric functions) [1]. The experience with their
applications has already been discussed in [3].
2.2 Results of identification
Two methods, with linear splines and Fourier approximation have
been applicated for evaluation of signals detected on heat exchangers. The results obtained by classical method of Fourier
approximation (without regularization) and with suggested regularization are presented on Figs.1 and 2.
The similar results obtained with another independent method, using linear splines as approximation,
increase the probability that the shape of E(t) is correct. This method was used for the signals analysis obtained
from the two heat exchangers (see Figs. 3 and 4).
3. RTD of gas flow in chamber modelling.
Simultaneous removal SO2 and NOx from industrial gas flow by electron beam processing has important
role in an environmental preservation. The efficiency of an gas chamber used for the treatment of
flue gases and other gaseous emissions are strongly influenced by gas flow pattern.
The measurement of RTD with radiotracer in a pilot plant chamber has helped to find optimal geometry and
optimal working conditions. The interesting information about the influence of baffles situated
inside of the reactor chamber can be obtained by parametrical analysis.
3.1 Identification by nonlinear regression (parametrical analysis)
The results of nonparametrical analysis is the course of impulse response E(t), i.e. RTD. According to
its shape and according character of apparatus it is possible to suggest mathematical model for description of
RTD by means of differential or algebraic equations. PC programs for RTD analysis [1] was prepared for
solution which is usually performed by numerical integration in time domain (using Runge-Kutta or Euler
method) and estimation of model parameters is based upon the least squares method, i.e. upon minimization the
sum of squares of differences between measured and computed responses. This is problem of nonlinear
regression which can be solved by Marquard-Levenberger method adapted for model defined as a set of ordinary
differential equations.
3.2 Results of parametrical analysis.
The input - output signals measured on
the chamber with vertically situated baffles and
on the same chamber without baffles were treated
by nonparametrical identification method using
linear splines with regularization. While the
model of series ideally mixed regions with
backmixing f (see Fig.7b) was suggested for
the chamber without baffles, the combined model of series ideally mixed regions with cross flow f and dead
volumes -V2- was used for the chamber with the baffles (see Fig.7a). The second model was also used for
chamber without baffles with the better results (see Figs 8 and 9). The small differences between the results
of nonparametrical and parametrical analysis are evident from the next Figs. 10 and 11.
From the results it follows that the ratio of dead / active volume is smaller and that the
cross flow f is bigger for the chamber with baffles.
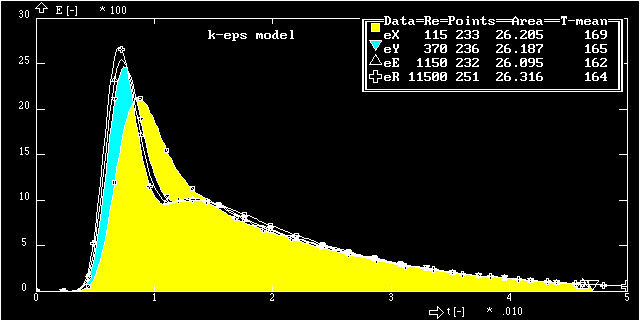
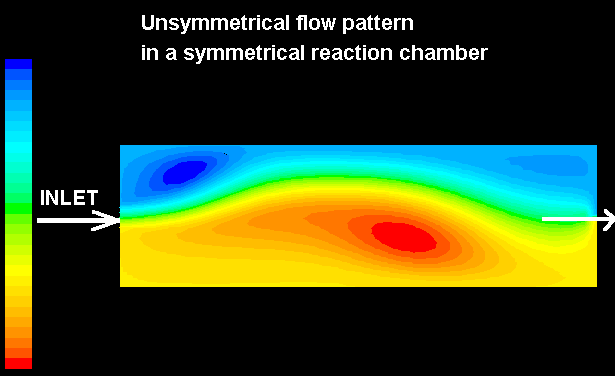
4. Prediction of RTD for different Re - Numerical modelling.
We shall consider steady, incompressible flows in the numerical analysis of the substantially simplified
reactor chamber. The chamber was assumed to be planar instead of circular, so that only two dimensional
numerical modelling can be used. The two different geometries was characterized by the following parameters:
Length LA=1 m, height HA=0.3 m and the inlet channel width HAi=0.052 m. The three baffles of the height
HAb=0.2 m was situated at the distances 0.25, 0.5, 0.75 m from the reactor chamber inlet, see the following figure
1 (geometry A). The second geometry (B) was slightly different: LB=0.7 m, HB=0.257 m, only two baffles
HBb=0.1836 m, and inlet width HBi=0.014 m.
Fluent - streamlines [38K] (click here)
The flowfield was computed by program Fluent for constant inlet velocity of gas (air), uAi=0.03 m/s.
Corresponding average axial velocity in the cross-section of reactor is 0.00517 m/s and the mean residence time
=184 s ( =193 seconds for the vessel without baffles respectively). The velocity field was calculated
for different
viscosities so that the influence of Re (=11.5, 115, 370, 1150) upon the Residence Time Distribution can
be estimated. All the cases were computed under assumption of either laminar and turbulent flow regime, using
k-epsilon model for turbulent flow.
There are several possibilities how to
evaluate RTD from the velocities and k-eps fields.
The standard procedure, offered by Fluent, is based
upon particle tracking. We cannot recommend this
method, because it is not possible to avoid particles
trapping in recirculation regions even for laminar
flows; the resulting integral distribution function
F(t) is distorted considerably especially for long
times t. Probably much better, though more time
consuming procedure, is based upon modelling of
transient temperature/concentration field, setting a
short pulse at the inlet. In all the following
computations we specified a triangular temperature
pulse having mean duration 1 second (which is
only 0.5% of the mean residence time), so that the
time course of the mean calorimetric temperature monitored at the chamber outlet can be considered as the
impulse response E(t). It is true that even if the wall are thermally insulated, the results are affected by
dispersion of temperature pulse by molecular diffusion. This influence can be seen in Fig.2, where
impulse responses (evaluated from Navier Stokes equations for Re=115 and for thermal conductivities =0.024
of air with an artificially decreased thermal conductivity =0.01 W.m-1.K-1 ) are presented.
Fig.2 Impulse responses for Re=115 (click here)
It is obvious, that the
smaller thermal conductivity gives slightly sharper impulse response, but the difference is acceptable.
It is also obvious, that the
mean residence time t=185 s evaluated from the numerically computed first moment compares very well with
the theoretical value t=184 s for thermal conductivity=0.01 W.m-1.K-1.
The following
Fig.3 (click here)
shows differences
between the laminar and the turbulent flow regimes, again
for the same Re=115. It is apparent, that while the
first appearance time is nearly the same (which is
remarkable), the laminar model unlike the turbulent
one predicts two peaks of E(t).
Decreasing Re downto 11.5 (which is
definitely in the laminar flow regime) has
substantial effect upon RTD, see the Fig.4. The
mean residence time t evaluated for Re=11.5 is too
short, probably due to tail extrapolation (numerical
solution by Fluent ended at time 300 s). In the
turbulent regime, the influence of Re upon the
residence time distribution is not so high,
nevertheless cannot be neglected, see Fig.5.
To evaluate the influence of baffles, the same
analysis was performed using empty reactor chamber -
without baffles. The following Figure 7 shows
comparison for Re=115. The apparent discrepancy in the mean residence time for laminar model prediction
(theoretical mean residence time should be in this case 193 seconds) is probably caused by the tail extrapolation (from the time 300
seconds). The large difference between the laminar and turbulent model emphasize the question: what is the real
flow regime? Some experimental results (e.g. Acrivos 1982) indicate that stable laminar flow in a sudden
expansion can be expected up to Re(100); our results confirm, that there does not exist stable and axially
symmetrical velocity field for Re=115, see Figure 6.
References:
1. Acrivos A., Schrader M.L.: Steady flow in a sudden expansion at high Reynolds numbers, Phys. of
Fluids 25(6), (1982), pp. 923-930
2 Zitny R., Thyn J.,"Computer programs for Residence Time Distribution Analysis,
Tecdoc IAEA, Vienna (will be issued)
3 Zitny R.:"RTD identification methods and their application for chemical equipment
design,Habil. thesis, Czech Technical University, Prague(1990)
4 Thyn J., Zitny R.,"Problems of RTD analysis with applications of radiotracers"
International Conference on Isotopes ,Beijing, China, (1995)