Znak katedry

Department of process engineering U218

Int.Conf.Fluid Mech. 94

TRANSIT TIME METHOD FOR FLOWRATE MEASUREMENT

ZITNY,R., SESTAK,J. and AMBROS,F.

SUMMARY

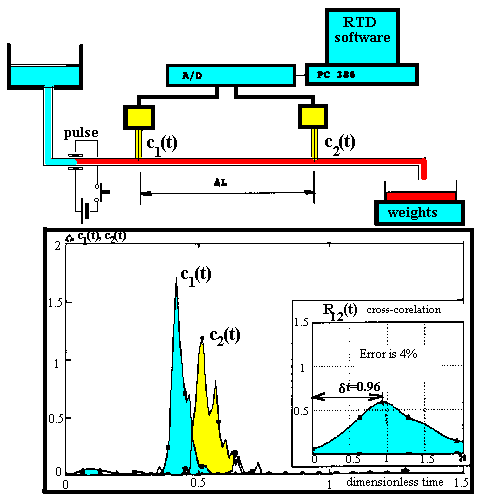
Transit time method is based on the determination of the time necessary for a tracer to pass between two detectors located e.g. in a pipe (see Fig below). As a tracer, concentration or thermal pulses are frequently used. The time shift between registered responses of the detectors can be evaluated by the correlation method which is capable to suppress the signal fluctuations. However, the results obtained on using this method depend upon the shape of responses and they are thus influenced by the flow field in the tube. In the case of turbulent flow the time responses are evaluated on the basis of axial dispersion or cascade of ideally mixed vessels models, while in the laminar flow region the numerical solution of the Fourier Kirchhoff equation is used. The cross correlation functions computed according to the mentioned models enable to predict the systematic error of the correlation method as a function of the Peclet number and the instrument geometry.

The following figure illustrates principles of transit time method
We discuss the following question: Is it true, that the maximum of cross-correlation function R12(t) corresponds to the transit time? Or, equivalently, is it possible to compute the flowrate in a duct using simple relation

Flowrate = Cross_section x Distance_of_detectors / TR12 ?

The answer is generally No, because responses c1(t) and c2(t) are not only time-shifted, but also distorted by dispersion. This influence will be analysed separately for turbulent and laminar flow regimes in a pipe.

Turbulent Flow

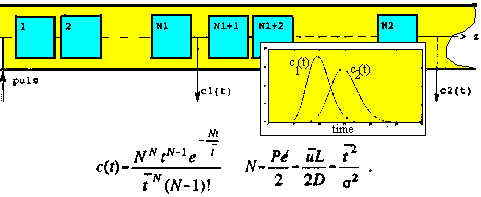
In this case it is possible to assume that the intensive transversal mixing justifies the use of the axial dispersion model or the model of series of ideally mixed vessels for description of responses c1(t) and c2(t). We analyzed both, and results are very similar: they are summarized in the following table.

R12(t) for series of ideal mixers
Error estimation based upon variances of the measured responses c1(t), c2(t)
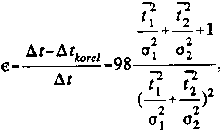
Remark: the variances and mean residence times of the two monitored responses are not independent (see e.g. relation between N, variance and mean time below the scheme), and their relation should be fully determined by the relative position of detectors with respect to the injection point.

Laminar Flow

In this case the radial temperature/concentrations profiles cannot be usually ignored. Only for very small flowrates (for very small Peclet numbers) the molecular diffusion flattens the radial temperature profile so that the axial dispersion model can be applied (Taylor Aris dispersion). On the other hand, complete neglection of molecular diffusion, i.e. the assumption of purely convective transfer, is justified only for high Peclet number. Flowrate evaluation based upon the cross-correlation of responses c1(t), c2(t) is easy only in these two limiting cases, i.e. for very large or very small Peclet numbers. The intermediate region of Peclet numbers was analyzed by means of numerical solution of Fourier Kirchoff equation, prescribing short temperature pulse at the inlet (Finite differences upwind schemes /Leonard/ or Control Volumes Method /Fluent/ were used). The numerically obtained time courses of temperature at two locations were processed by FFT thus obtaining cross-correlation function R12(t).
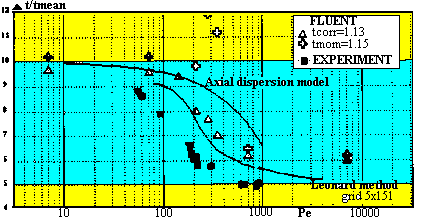
The results are plotted as the laminar transit time flowmeter characteristic in the following figure and compared with experimental results. The flowmeter characteristic, which is a unique function of flowmeter geometry, relates relative transit time Tr and Pe. The relative transit time is defined as the ratio of the measured transit time TR12 (evaluated e.g. from the cross-correlation function) and the "true" mean residence time, corresponding to the actual flowrate. Then

Flowrate = Cross_section x Distance_of_detectors / TR12 / Tr

Flowmeter characteristic denoted as Axial dispersion model is derived from the previous analysis of the axial dispersion model assuming dispersion coefficient D=R2u2/48a (Taylor Aris dispersion)
Flowmeter characteristic depends upon geometry: The characteristic shown left assumes that both detectors (thermistors) measure temperature courses at the center of pipe with inner radius R=5 mm, and distances of the detectors from the source of pulses are L1=90 mm, L2=154 mm.

It would be very desirable (but it is also very difficult) to find analytical solution, i.e. analytical expression of R12(t) for arbitrary Peclet number and arbitrary axial and radial locations of detectors. We have got only partial result, Laplace transformation of temperature response to a short pulse (duration DELTA) at the dimensionless axial distance zeta from the pulse generator and at the dimensionless radial distance of thermometer rho. For detector located at the center of pipe holds:


This expression is only approximation derived under following assumptions: This aproximation is valid only for small Peclet numbers, but it enables simple evaluation of the cross-correlation function by FFT. Flowmeter characteristics predicted by this procedure slightly differ from those, obtained by Taylor Aris axial dispersion model.

CONCLUSIONS:

The most important conclusion is that the flowmeter characteristics are nonlinear; only for very small Peclet number (small velocities) the radial diffusion flattens the temperature radial profile, so that the model of axial dispersion (3) can be applied for error estimation.

REFERENCES:

[1] Petryka,L. et al: The multidetector system and data processing by means of correlation methods, Proceedings of the RRAI, Berlin, 1991, 121-133
[2] Zitny,R.;Sest k,J.;Ambros,F.: Transit time method for flowrate measurement, Workshop 93 - fluid mechanics, CTU Prague, 1992, 55-56
[3] Abesekera,S.A.; Beck,M.S.: Liquid flow measurement by cross- correlation of temperature fluctuations, Trans. of Inst. of Measurement and Control, Vol. 5, (1972), pp. 435-439
[4] Taylor,G.I.: Dispersion of soluble Matter in solvent flowing slowly through a tube, Proc.Roy.Soc.,A219,(1953)
[5] International Standard ISO 2975/VI: Measurement of water flow in closed conduits - tracer methods. Part VI: Transit time method using non- radioactive tracers, International Organization for Standardization 1977
[6] Kebort,P.: Flowrate measurement by correlation method (in czech), Dipl. thesis, CTU Prague, 1992
·


@TEC: 3. 3.2003 Change language to English DEFAULT BACKpeoples U218 FS-CVUT Interesting links mailto: Zitny