Measurement procedure |

| Simplest experiment with tap water.
- Switch on PC, and power supply of transducers.
Start program PCL818 or OHMICAS (time step 1 s, 9 channels).
- Set 3-way cock K1 to position 1 (K1/1), and open valve V2 (filling water).
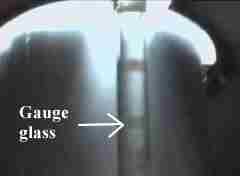
Check water level visually (glass gauge) and on display (channel 8).
After filling close V2.
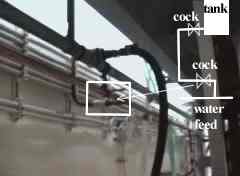
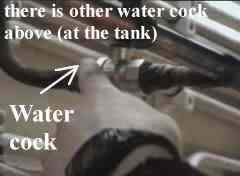
- Set cock K3/1 and K1/4. Water flows to the outlet.
Estimate the flowrate (using F10 in the OHMICAS program). Adjust the flowrate by valve V1.
- Switch on heating and adjust electrical power (check overloading on the control panel).
Wait until the steady state is achieved.
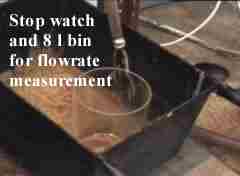
- Precise value of flowrate can be obtained by measurement of volume at a time interval.
Use stop-watch and calibrated vessel (2 to 8 litres).
|
|
Photogallery |
| Filling the tank by water - Check the level of water by electronic gauge and visually |

|
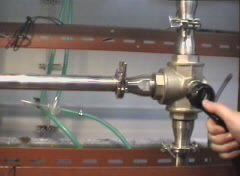
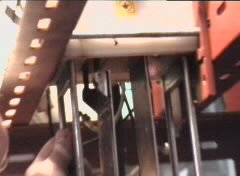
| Set the valve at outlet (flowrate adjustment). Flowrate measurement. Positions of 3-way cocks. |


|
| Viscous liquids-driving pressure of compressed air adjustment |


|
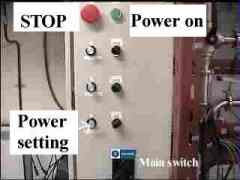
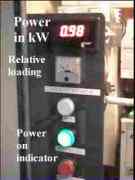
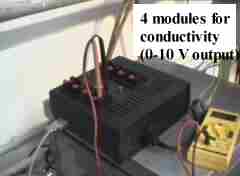
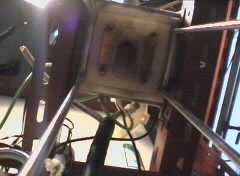
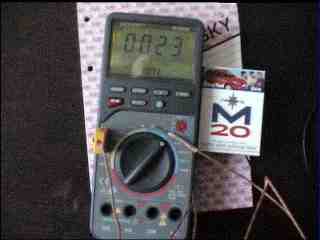
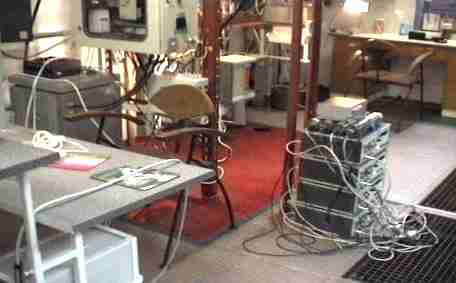
| Control and Computer (temperature/level/power/ measurement) |

|
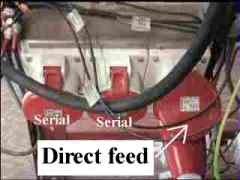
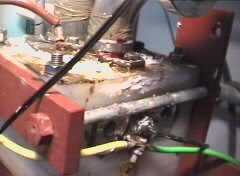
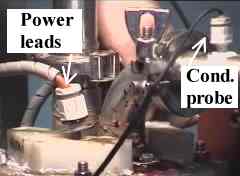
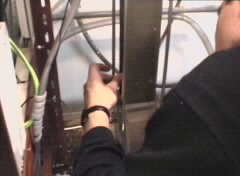
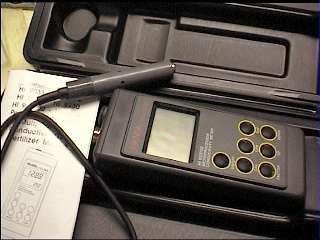
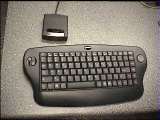
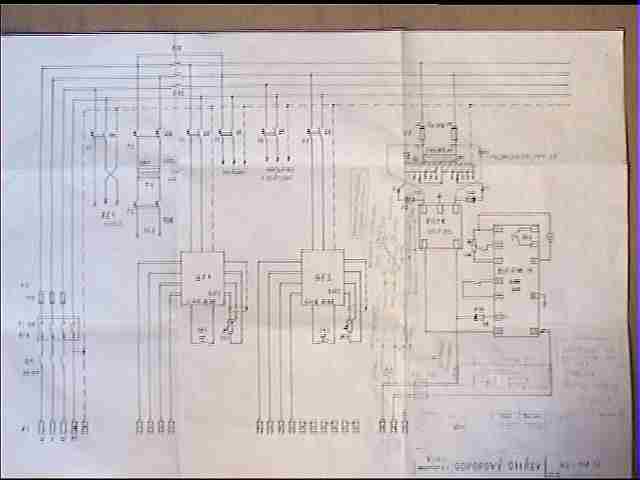
| Electrical conductivity probes, electronics connection |


|
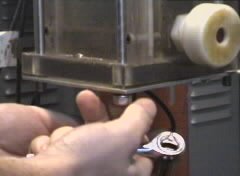
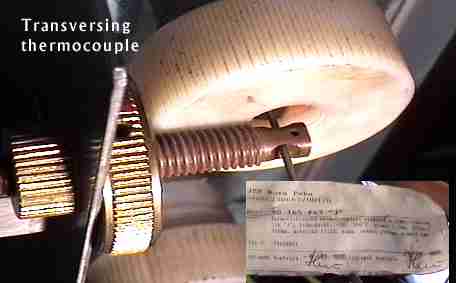
| Disassembly of head, heating tank and electrodes |

|


|


|
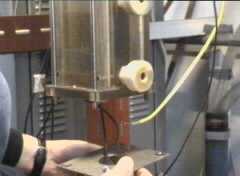
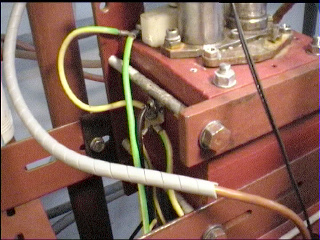
| Assembly of electrodes and heating tank |


|
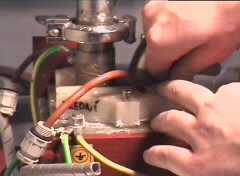
| Assembly of head (power and temperature) |


|
OHMICAS and PCL818 -programs for monitoring T,P,V,C |
|---|
| Program OHMICAS displays and records data from max.16 channels of A/D PCL 818 card
(Single Ended analog inputs).
Channels 1-6 are temperatures [C] (tank from bottom to head), 7 electrical power [kW], 8 liquid level [litres],
9-11 temperatures [C] (inlet temperature in head and temperatures in tanks),
12-15 conductivities, and channel 16 is auxiliary. Voltage (in the range +-10 V) is converted to physical quantities by
linear transformation. |
 You can have this program in executable form
OHMICAS.EXE, or a source form
OHMICAS.FOR. You can have this program in executable form
OHMICAS.EXE, or a source form
OHMICAS.FOR.
|
 A new development is program PCL818
PCL.ZIP (source and exe)
Modified 23.5.2001,
which controls
two PCL818 cards (32 channels) at base addresses 300H, 310H. Quadratic transformation of acquired data can be adjusted interactively.
A new algorithm for simultaneous calibration (Word-7 [140KB])
of several thermocouples is implemented. Also a new algorithm for
deconvolution (Word 40kB) has been implemented.
A new development is program PCL818
PCL.ZIP (source and exe)
Modified 23.5.2001,
which controls
two PCL818 cards (32 channels) at base addresses 300H, 310H. Quadratic transformation of acquired data can be adjusted interactively.
A new algorithm for simultaneous calibration (Word-7 [140KB])
of several thermocouples is implemented. Also a new algorithm for
deconvolution (Word 40kB) has been implemented.
|
OHN -numerical solution of temperature field (perforated electrodes) |
|---|
| Program OHN solves 2D distribution of temperatures by Control Volume method. Density is assumed constant,
this is oversimplification.
|
 You can have this program in executable form
OHN.EXE, or a source form
OHN.FOR.
You can have this program in executable form
OHN.EXE, or a source form
OHN.FOR.
|
CVASYM -asymmetry of temperature field (perforated electrodes) |
|---|
| Natural convection. Integral model. Suitable for prediction of influence of viscosity, power, and first
of all geometry (width of lateral channels, geometry of perforation) upon asymmetry of flow in lateral channels, and
cross-flow through perforation. All properties are constant, except specific electrical conductivity and density.
RTD model is included - results were compared with measurement by KCl and TC99 (presented at RCA IAEA Prague November 2000).
|
 You can have this program in executable form
CVASYM.EXE, or a source form
CVASYM.FOR.
You can have this program in executable form
CVASYM.EXE, or a source form
CVASYM.FOR.
|
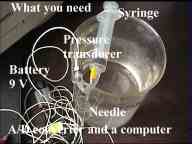
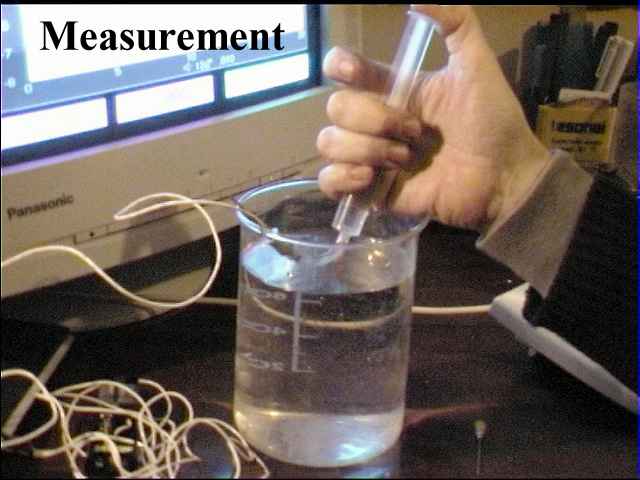
Capillary viscometer (by product of tracer injection monitoring by a pressure transducer)
|
 |
 |
 |
- Syringe (10ml) and needles
- XTM-190M, 9V battery
-
PCLD-8115, 818L
|
Kulite XTM-190M 4-wires:
Red,Black(battery),Green,White(A/D card).
Output 75mV/full range |
Start program VISCOM. Select needle according to viscosity, and treshold of Voltage. Program identifies start and end of run automatically. |
 |
 |
 |
| Inject sample and follow pressure time course. Begin and end of sampling is indicated. If the run was too short (less than 2 s) a message is shown INVALID. |
Measurement can be repeated several times and basic statistics are shown: mean viscosity, estimated error, range of shear rates, max.Reynolds number. |
Kulite specification,
needles selection. |
 |
 |
 |
| Screen during measurement |
[F10]-rheograms |
Viscosity range can be estimated for a selected needle using Excel sheet. |
| You can have software
VISCOM.EXE in executable,
VISCOM.FOR or a source form.
|


 You can have this program in executable form
OHMICAS.EXE, or a source form
OHMICAS.FOR.
You can have this program in executable form
OHMICAS.EXE, or a source form
OHMICAS.FOR.
 A new development is program PCL818
PCL.ZIP (source and exe)
Modified 23.5.2001,
which controls
two PCL818 cards (32 channels) at base addresses 300H, 310H. Quadratic transformation of acquired data can be adjusted interactively.
A new algorithm for simultaneous calibration (Word-7 [140KB])
of several thermocouples is implemented. Also a new algorithm for
deconvolution (Word 40kB) has been implemented.
A new development is program PCL818
PCL.ZIP (source and exe)
Modified 23.5.2001,
which controls
two PCL818 cards (32 channels) at base addresses 300H, 310H. Quadratic transformation of acquired data can be adjusted interactively.
A new algorithm for simultaneous calibration (Word-7 [140KB])
of several thermocouples is implemented. Also a new algorithm for
deconvolution (Word 40kB) has been implemented.


